Tahoe Weather Now
The values listed in the table below are from the last 30 minutes of the previous hour downloaded from the 4 NASA/JPL-UCD buoys moored on Lake Tahoe CA/NV. Figure 1 shows the location of each of the buoys. The buoy data are downloaded every hour, on the hour, 24 hours a day. The web site is updated at 30 minutes past the hour, every hour, 24 hours a day. For example, if you check the web site at 7:35 am you will be presented with data for the period from 6:30-7:00 am. However, if you access the site at 7:15 am you will be presented with data from 5:30-6:00 am because the update at 30 minutes past the hour for the period 6:30-7:00 am will not have taken place. The values presented in the various fields are in the format "min:average:max". For example, if the minimum, average and maximum wind speeds during the 30 minute period were 5, 7 and 9 m/s respectively. Then the wind speed entry will be 5.00:7.00:9.00. Notice the colons (:) that separate the min, average and max. Another way to think of this is if you want the maximum gust then look at the value for the maximum. The original measurements from which the statistics are derived are instantaneous measurements of the various parameters made every 2 minutes. The data are raw data and have not been quality checked. They are provided for informational purposes only and should not be used for scientific studies. If you would like access to the science quality data please contact the author. If no data are available a value of -99 is placed in the table.
Switch to Metric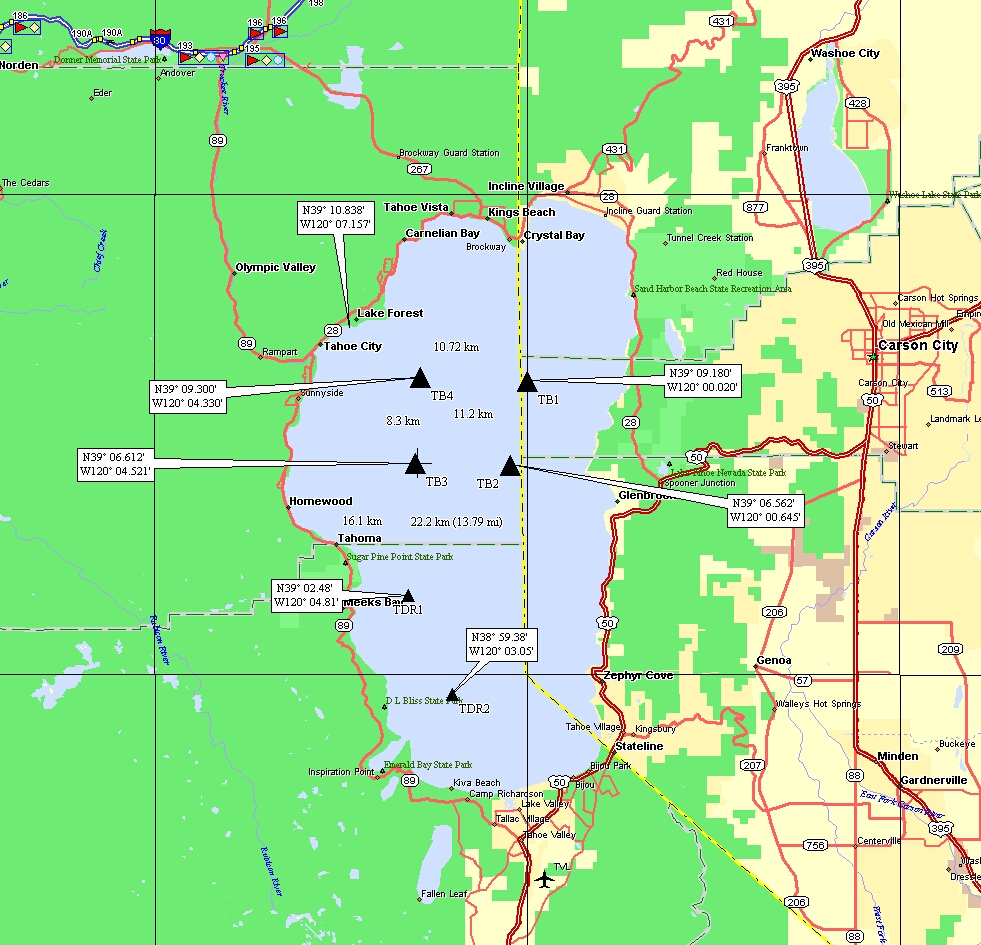
| Parameter | Units | TB1 | TB1a | TB2 | TB2a | TB3 | TB3a | TB4 | TB4a |
|---|---|---|---|---|---|---|---|---|---|
| Last Update Date (UTC) | YYYY-MM-DD | 2024-04-19 | 2024-04-19 | 2024-04-19 | 2024-04-19 | 2024-04-19 | 2024-04-19 | 2024-04-19 | 2024-04-19 |
| Last Update Time (UTC) | HH:MM:SS | 09:12:08 | 09:12:08 | 09:12:08 | 09:12:08 | 09:12:08 | 09:12:08 | 09:12:08 | 09:12:08 |
| N Mins to extract | MM | 30 | 30 | 30 | 30 | 30 | 30 | 30 | 30 |
| Extract Meterological Start Date | YYYY-MM-DD | 2024-04-19 | 2024-04-19 | 2024-04-19 | 2024-04-19 | 2024-04-19 | 2024-04-19 | 2024-04-19 | 2024-04-19 |
| Extract Meterological Start Time | HH:MM:SS | 07:31:00 | 07:31:00 | 07:31:00 | 07:31:00 | 07:31:00 | 07:31:00 | 07:31:00 | 07:31:00 |
| Extract Meterological Stop Time | HH:MM:SS | 08:59:00 | 08:59:00 | 08:59:00 | 08:59:00 | 08:59:00 | 08:59:00 | 08:59:00 | 08:59:00 |
| Num Meterological Samps Extracted | Count | 89.0 | 89.0 | 89.0 | 89.0 | 88.0 | 88.0 | 85.0 | 85.0 |
| Meterological Download State | Condition | FRESH | FRESH | FRESH | FRESH | FRESH | FRESH | FRESH | FRESH |
| Wind Speed | mh-1 | 0.0:1.7:4.3 | 0.0:1.8:3.8 | 0.0:1.2:4.5 | 0.0:0.0:0.0 | 0.0:3.6:7.2 | 0.0:3.8:8.5 | 0.0:4.0:7.6 | 1.1:4.3:8.1 |
| Wind Direction | degrees | 223:247:288 | 208:252:297 | 202:248:327 | 203:240:285 | 1:279:355 | 23:276:343 | 206:250:287 | 237:264:317 |
| Air Temperature | °F | 43.9:44.3:45.0 | 43.3:43.9:44.6 | 42.4:43.1:44.1 | 43.0:44.0:45.5 | 41.9:42.2:42.4 | 41.7:42.2:42.8 | 41.9:42.3:43.2 | 41.0:41.7:42.6 |
| Relative Humidity | % | 79.8:85.7:88.9 | 82.4:87.6:90.5 | 77.2:84.3:88.5 | 74.4:81.1:84.9 | 71.3:76.3:83.0 | 77.7:84.8:96.6 | 73.3:80.3:85.2 | 72.0:77.9:83.3 |
| Pressure | inHg | 23:23:23 | 23:23:23 | 23:23:23 | 23:23:23 | 23:23:23 | 23:23:23 | 23:23:23 | 23:23:23 |
| Net Radiation | Wft-2 | -99.0:-99.0:-99.0 | -99.0:-99.0:-99.0 | -99.0:-99.0:-99.0 | -99.0:-99.0:-99.0 | -99.0:-99.0:-99.0 | -99.0:-99.0:-99.0 | -99.0:-99.0:-99.0 | -99.0:-99.0:-99.0 |
| Extract Data Start Date | YYYY-MM-DD | 2024-04-19 | 2024-04-19 | 2024-04-19 | 2024-04-19 | 2024-04-19 | 2024-04-19 | 2024-04-19 | 2024-04-19 |
| Extract Data Start Time | HH:MM:SS | 07:31:00 | 07:31:00 | 07:31:00 | 07:31:00 | 07:31:00 | 07:31:00 | 07:31:00 | 07:31:00 |
| Extract Data Stop Time | HH:MM:SS | 08:59:00 | 08:59:00 | 08:59:00 | 08:59:00 | 08:59:00 | 08:59:00 | 08:59:00 | 08:59:00 |
| Num. Data Samps | Count | 89.0 | 89.0 | 89.0 | 89.0 | 88.0 | 88.0 | 85.0 | 85.0 |
| Data Download State | Condition | FRESH | FRESH | FRESH | FRESH | FRESH | FRESH | FRESH | FRESH |
| Water temp.: 5.5m | °F | 44.4:44.5:44.5 | 44.4:44.5:44.5 | 44.6:44.6:44.6 | 44.6:44.6:44.6 | 43.6:43.7:43.8 | 43.6:43.7:43.8 | 44.2:44.3:44.3 | 44.2:44.3:44.3 |
| Water temp.: 5.0m | °F | 44.4:44.5:44.5 | 44.4:44.5:44.5 | 44.5:44.6:44.6 | 44.5:44.6:44.6 | 43.6:43.7:43.8 | 43.6:43.7:43.8 | 44.2:44.3:44.4 | 44.2:44.3:44.4 |
| Water temp.: 4.0m | °F | 44.5:44.6:44.6 | 44.5:44.6:44.6 | 44.5:44.6:44.6 | 44.5:44.6:44.6 | 43.6:43.7:43.8 | 43.6:43.7:43.8 | 44.2:44.3:44.3 | 44.2:44.3:44.3 |
| Water temp.: 3.0m | °F | 44.5:44.7:44.9 | 44.5:44.7:44.9 | 44.6:44.6:44.6 | 44.6:44.6:44.6 | 43.6:43.7:43.8 | 43.6:43.7:43.8 | 44.2:44.3:44.4 | 44.2:44.3:44.4 |
| Water temp.: 2.0m | °F | 44.5:44.7:44.9 | 44.5:44.7:44.9 | 44.6:44.6:44.6 | 44.6:44.6:44.6 | 43.6:43.7:43.8 | 43.6:43.7:43.8 | 44.2:44.3:44.4 | 44.2:44.3:44.4 |
| Water temp.: 1.5m | °F | 44.5:44.7:44.9 | 44.5:44.7:44.9 | 44.6:44.6:44.6 | 44.6:44.6:44.6 | 43.6:43.7:43.8 | 43.6:43.7:43.8 | 44.2:44.3:44.4 | 44.2:44.3:44.4 |
| Water temp.: 1.0m | °F | 44.5:44.8:44.9 | 44.5:44.8:44.9 | 44.5:44.6:44.6 | 44.5:44.6:44.6 | 43.6:43.7:43.8 | 43.6:43.7:43.8 | 44.2:44.3:44.4 | 44.2:44.3:44.4 |
| Water temp.: 0.5m | °F | 44.5:44.7:44.9 | 44.5:44.7:44.9 | 44.5:44.6:44.6 | 44.5:44.6:44.6 | 43.6:43.7:43.8 | 43.6:43.7:43.8 | 44.2:44.3:44.4 | 44.2:44.3:44.4 |
| Uncorrected Rad temp. | °F | 42.0:42.4:43.1 | 32.0:32.0:32.0 | 42.0:42.5:43.2 | 32.0:32.0:32.0 | 41.2:41.9:42.5 | 32.0:32.0:32.0 | 42.3:42.6:42.8 | 32.0:32.0:32.0 |
| Heitronics temperature | °F | 43.2:43.6:44.2 | 43.2:43.6:44.2 | 42.3:43.1:44.2 | 42.3:43.1:44.2 | 41.4:42.2:43.4 | 41.4:42.2:43.4 | 42.3:43.1:43.9 | 42.3:43.1:43.9 |
| Extract RTD Start Date | YYYY-MM-DD | 2024-04-19 | 2024-04-19 | 2024-04-19 | 2024-04-19 | 2024-04-19 | 2024-04-19 | 2024-04-19 | 2024-04-19 |
| Extract RTD Start Time | HH:MM:SS | 07:31:00 | 07:31:00 | 07:31:00 | 07:31:00 | 07:31:00 | 07:31:00 | 07:31:00 | 07:31:00 |
| Extract RTD Stop Time | HH:MM:SS | 08:59:00 | 08:59:00 | 08:59:00 | 08:59:00 | 08:59:00 | 08:59:00 | 08:59:00 | 08:59:00 |
| Num. RTD samps | Count | 89.0 | 89.0 | 89.0 | 89.0 | 88.0 | 88.0 | 85.0 | 85.0 |
| RTD Download State | Condition | FRESH | FRESH | FRESH | FRESH | FRESH | FRESH | FRESH | FRESH |
| Power | V | 12.2:12.3:12.3 | 12.2:12.3:12.3 | 11.7:12.0:12.1 | 11.7:12.0:12.1 | 11.8:12.1:12.1 | 11.8:12.1:12.1 | 12.0:12.1:12.2 | 12.0:12.1:12.2 |